
A numerical transport model was used to analyze the collected data from FTIR-ATR, modeled as a transient, one-dimensional problem. The full FTIR-ATR spectra between 400 cm-1 and 4000 cm-1 of SEO/LiTFSI was first collected, as shown in the figures below. Specifically, the CF3 peak of LiTFSI, between the wavenumber 1156 cm-1 to 1215 cm–is analyzed to see the diffusion occurring most optimally. The CF3 peak is chosen due to the separation from other vibrational peaks, and the pronounced change of its intensity with changing concentration. Fig 2 shows the peak beginning with red, meaning the beginning time point, to the final, blue time point, when the system reaches steady state. This means that the absorbance is increasing, as the area underneath the CF3 peak is increasing. Because absorbance is correlated to concentration, the concentration of the salt is increasing at the crystal ATR, which is where the measurements are being recorded. Thus, the. integrated absorbance, has been normalized from zero to one.
Normalized absorbance is equal to normalized concentration because the constants of the beer lambert law cancel. Therefore, diffusion models can be applied directly to normalized absorbance values without the need for calibration. The normalized absorbance from a characteristic measure is shown in the figures as well below. The diffusion coefficients were then found numerically through fitting an equation to the integrated absorbance data in MATLAB, with initial conditions as shown in Kim et al. 2020. The spectra below are from the temperature gradient induced diffusion measurements.
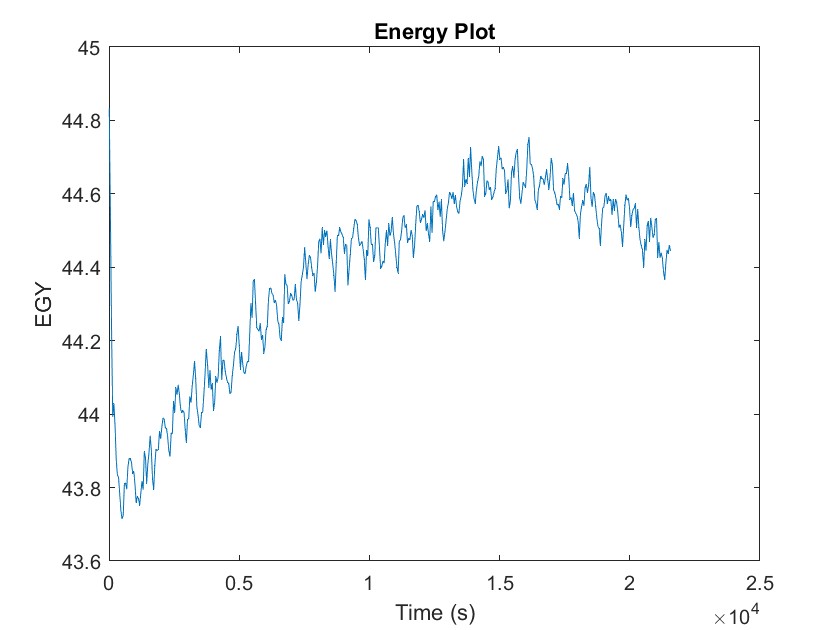
Step 1: Data Conversion
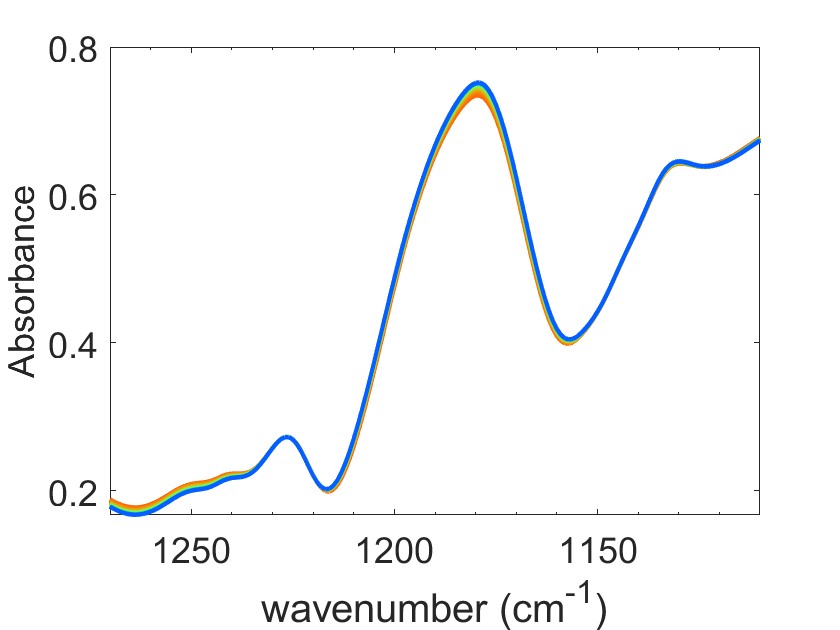
Step 2: Isolate and Integrate CF3 peak of LiTFSI
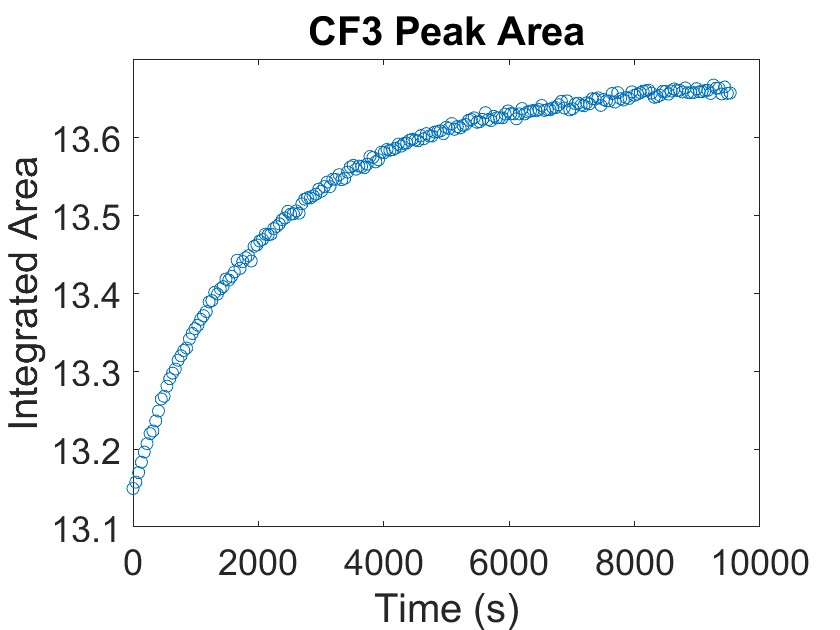

Step 3: Integrate and Normalized absorbance, with the analytical checking solution.
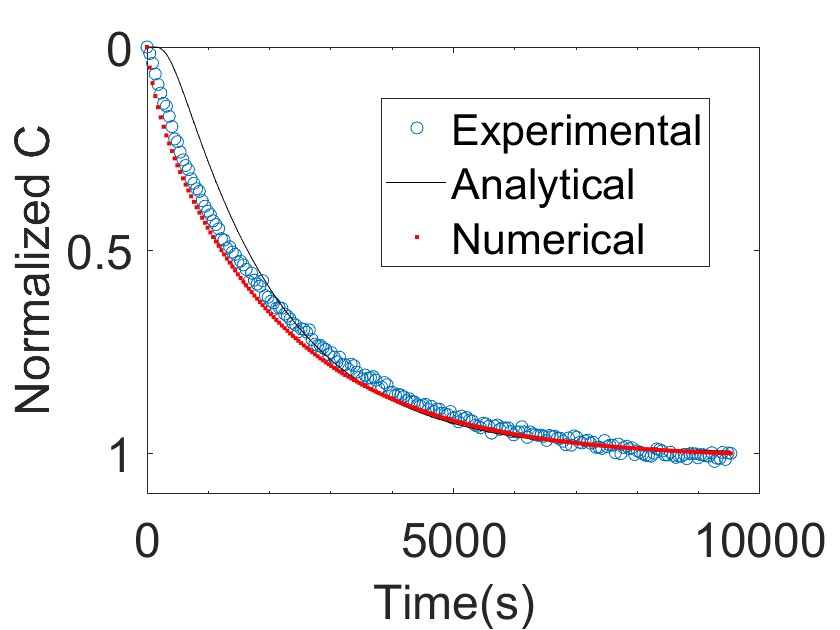
Run the numerical fickian analysis (strictly for fickian diffusion and collect diffusion coefficients.
